| ▲ | nonethewiser 2 days ago |
| In some sense it's absurd. But historically its normal. And to be more precise, 25 years to halve is actually less inflation than the historical average of 3.29% from 1914-2025. At that rate it would take 21-22 years to halve. Actually there is a surprisingly good trick to be able to calculate this called the rule of 72. Take the inflation percentage (2, 3 %) and divide 72 by it. Thats how many years it will take to halve. Not completing accurate but actually very close. But yeah, inflation is a bitch over long time horizons. It makes me laugh when people say stocks are risky. Say you are 20 years old and want to save $2M USD for your retirement by 65. Expect that to be more like $470k. |
|
| ▲ | sudo_gopnik 2 days ago | parent | next [-] |
| Historically - it's actually NOT normal. Link and quote below that examines this with graphs but, the crux is that we have accepted higher inflation in order to achieve stable inflation that is predictable. "For the pre-Fed period (1790-1913), the average annual inflation was 0.4 percent with a coefficient of variation of 13.2. During the period 1941-2016, these figures changed to 3.5 percent and 0.8, respectively. If we look at the post-Volcker era (1988-2016), annual inflation was 2.2 percent on average with a coefficient of variation of 0.4." - Source: https://www.stlouisfed.org/publications/regional-economist/s... Also recommend Debt: The First 5000 Years (David Graeber) and Capital in the Twenty-First Century (Thomas Piketty) which cover this and more on how current concepts of finance and capital post-1914 are incredibly different from the majority of human civilization. I think a broader historical/anthropological approach is helpful here to understand why those tradeoffs were made. |
| |
| ▲ | Aurornis 2 days ago | parent [-] | | > "For the pre-Fed period (1790-1913), the average annual inflation was 0.4 percent with a coefficient of variation of 13.2. During the period 1941-2016, these figures changed to 3.5 percent and 0.8, respectively. If we look at the post-Volcker era (1988-2016), annual inflation was 2.2 percent on average with a coefficient of variation of 0.4." - Citing an average number is misleading since the chart of the value of a dollar during that time looks like a zig-zag with some massive swings in both directions. This means periods of severe deflation, too, which can be very bad for people. It definitely was not flat or consistently near zero, though citing an average number is a great way to give that impression. | | |
| ▲ | wredcoll a day ago | parent | next [-] | | Maybe a better metric is some kind of yearly median, i.e what you would actually experience living year by year. | |
| ▲ | dragonwriter a day ago | parent | prev [-] | | > Citing an average number is misleading Not when you are also citing the coefficient of variation it isn’t. > since the chart of the value of a dollar during that time looks like a zig-zag with some massive swings in both directions. Uh, exactly the claim made, “we have accepted higher inflation in order to achieve stable inflation that is predictable.” (emphasis added) Characterizing this as a bad thing is, IMO, quite bonkers, but so is denying that it is exactly what has happened. |
|
|
|
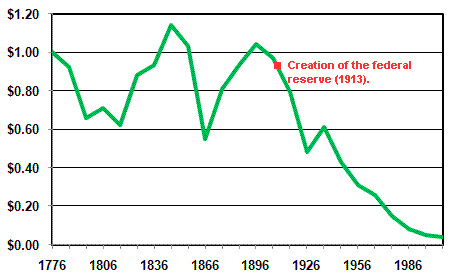
| ▲ | mothballed 2 days ago | parent | prev | next [-] |
| If you move to before the central bank was created in 1913, the dollar remained remarkably stable in relation, although it did oscillate, it never deviated more than 50% from the starting point until after creation of the fed. https://upload.wikimedia.org/wikipedia/commons/c/c7/Dollar_v... |
| |
| ▲ | somenameforme 2 days ago | parent | next [-] | | What is the source of data that image is using? It seems odd. A datum I quite like is the Campbell's Tomato Soup Inflation Index. [1] Since their introduction in 1897, Campbell's has sold the same tomato soup in the same size container. Its price remained quite stable until 1971 at which point it went into loony land, like many other data. [2] The point is that even after the central bank was introduced, the US remained on a literal or defacto gold standard, of varying sorts, until 1971. That's when Bretton Woods ended and the value of the USD became based on absolutely nothing and the government granted themselves the power to 'print' arbitrary amounts at their discretion. [1] - https://theglitteringeye.com/the-tomato-soup-index/ [2] - https://wtfhappenedin1971.com/ | | | |
| ▲ | woodruffw 2 days ago | parent | prev [-] | | It seems difficult to draw any inference from this, given how different the US’s economy and global position is in 2025 versus 1913. | | |
| ▲ | gbacon 2 days ago | parent | next [-] | | Lots of topics that we discuss on HN require careful thought and other difficult efforts but somehow do not extinguish our curiosity. Going back to the ancient Romans, an ounce of gold has always been able to purchase a suit of clothes. As the market becomes more efficient at producing goods and services, we should expect prices to decrease, not inflate. In some sectors, we do see this outcome but not in others. Yes, the analysis required to explain why is difficult, and perhaps more difficult is having to face conclusions that challenge one’s priors. | | |
| ▲ | woodruffw 2 days ago | parent [-] | | There’s a big gap between curiosity and making inferential leaps. > As the market becomes more efficient at producing goods and services, we should expect prices to decrease, not inflate. Yes, that’s why the cost of clothes has decreased in real terms. |
| |
| ▲ | mothballed 2 days ago | parent | prev [-] | | ... I was directly addressing GGP using 1914 as a cutoff. Now you object to the cutoff I didn't introduce only when someone introduce data on the other side of it? Funny how that magically ends up being the case. | | |
| ▲ | woodruffw 2 days ago | parent [-] | | To be clear, I think it’s also hard to make inferences after 1913. But it’s easier (and particularly after 1945, 1971, etc.) because the US’s geopolitical status after those periods is at least analogous and a matter of econometric research. | | |
| ▲ | mothballed 2 days ago | parent [-] | | The period from 1776-1913 arguably had as many changes as the period from 1913 to 2025. In the first 130 years of the US, the value of the dollar didn't change, as far as I can tell, more than 50% from the starting point. From 1913 to 2025, the dollar lost 96+% of its value. The difference between a ratio of 2:1 and a ratio of more like 30:1. | | |
| ▲ | woodruffw 2 days ago | parent [-] | | > The period from 1776-1913 arguably had as many changes as the period from 1913 to 2025. I'm not arguing it didn't. But I think in kind the US's global economic position didn't change substantially between full independence in 1783 and 1913. It grew during that period, but the idea of the US as a peer (and then dominant) economic world power is a distinctly post-WWI one. | | |
| ▲ | mothballed 2 days ago | parent [-] | | Why do you believe that makes the data comparison pre to post central bank irrelevant? |
|
|
|
|
|
|
|
| ▲ | Pooge a day ago | parent | prev | next [-] |
| > It makes me laugh when people say stocks are risky. I agree 100% with your thought. However, I've come with an explanation: people save $100k and the amount in itself will not budge unless they use that money. This, of course, is a flawed argument as the amount doesn't matter; what you can buy with it does. With stocks—I prefer ETFs but I digress—you do not know the amount you will have in 40 years (even if, historically, you would have made money in absolutely all cases). This uncertainty, coupled with lack of economics knowledge, is why people qualify stocks as "risky". However, instead of "risky", I think they mean "volatile". Cash is absolutely the riskiest of assets as it loses value in 100% of cases despite being more stable than stocks. And my cynic mind tells me that the banking industry has all to gain from telling people that "stocks are very risky", instilling fear and, instead, selling them over-complicated products where the bank is guaranteed to make a profit on the back of their clients. Of course, they tell them it's "100% safe". |
|
| ▲ | gbacon 2 days ago | parent | prev | next [-] |
| Your starting point of 1914 is strangely specific. Why did you choose it? |
|
| ▲ | rkowalick 2 days ago | parent | prev | next [-] |
| The correct calculation isn’t too hard either. If currency halves in purchasing power in 25 yrs, that means inflation is 100% in 25 years, so (1 + r)^25 = 2
r = 2^(1/25) - 1 ~ 2.8%
|
| |
|
| ▲ | jollyllama 2 days ago | parent | prev [-] |
| A span of time that happens to include The Great Depression. |