| ▲ | andruby 18 hours ago | ||||||||||||||||
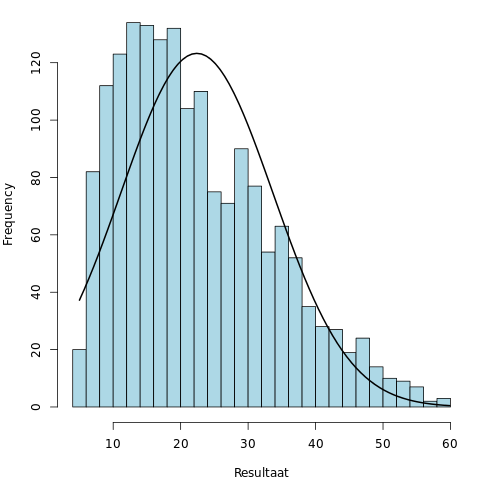
My family runs a blood analysis lab in Belgium for which I wrote some of the statistics gathering software. The thresholds for 25-OH vitamin D: <20 ng/mL → deficient, 20–30 ng/mL → insufficient. When I looked at all 1738 blood samples that had their Vitamin D tested between Feb 1, 2020 and Mar 13, 2020 (We were looking into the link between Vitamin D and COVID-19): The median (P50) was 20.1 ng/mL and the average was 22.4 ng/mL. Standard deviation: 11.24 ng/mL Half the samples were deficient, and the next 20% was insufficient. Coming out of winter in Europe in a country with limited sunshine: most of the population is deficient in Vitamin D. Histogram: https://files.catbox.moe/p785wx.png | |||||||||||||||||
| ▲ | vintermann 18 hours ago | parent | next [-] | ||||||||||||||||
Worth noting all the three big studies mentioned in the article were on Americans. | |||||||||||||||||
| |||||||||||||||||
| ▲ | bluenose69 12 hours ago | parent | prev | next [-] | ||||||||||||||||
The curve on your diagram makes me think that you've fitted a normal (Gaussian) curve to the data. By eye, the distribution looks a bit more like log-normal, and so if you're still working on the data, you might want to try that to see. Not that anything you've said or concluded seems wrong, though. | |||||||||||||||||
| |||||||||||||||||
| ▲ | dizhn 13 hours ago | parent | prev [-] | ||||||||||||||||
What do you think about the thresholds themselves? How often are they updated usually with new research? | |||||||||||||||||
| |||||||||||||||||