| ▲ | simonw 4 hours ago | |
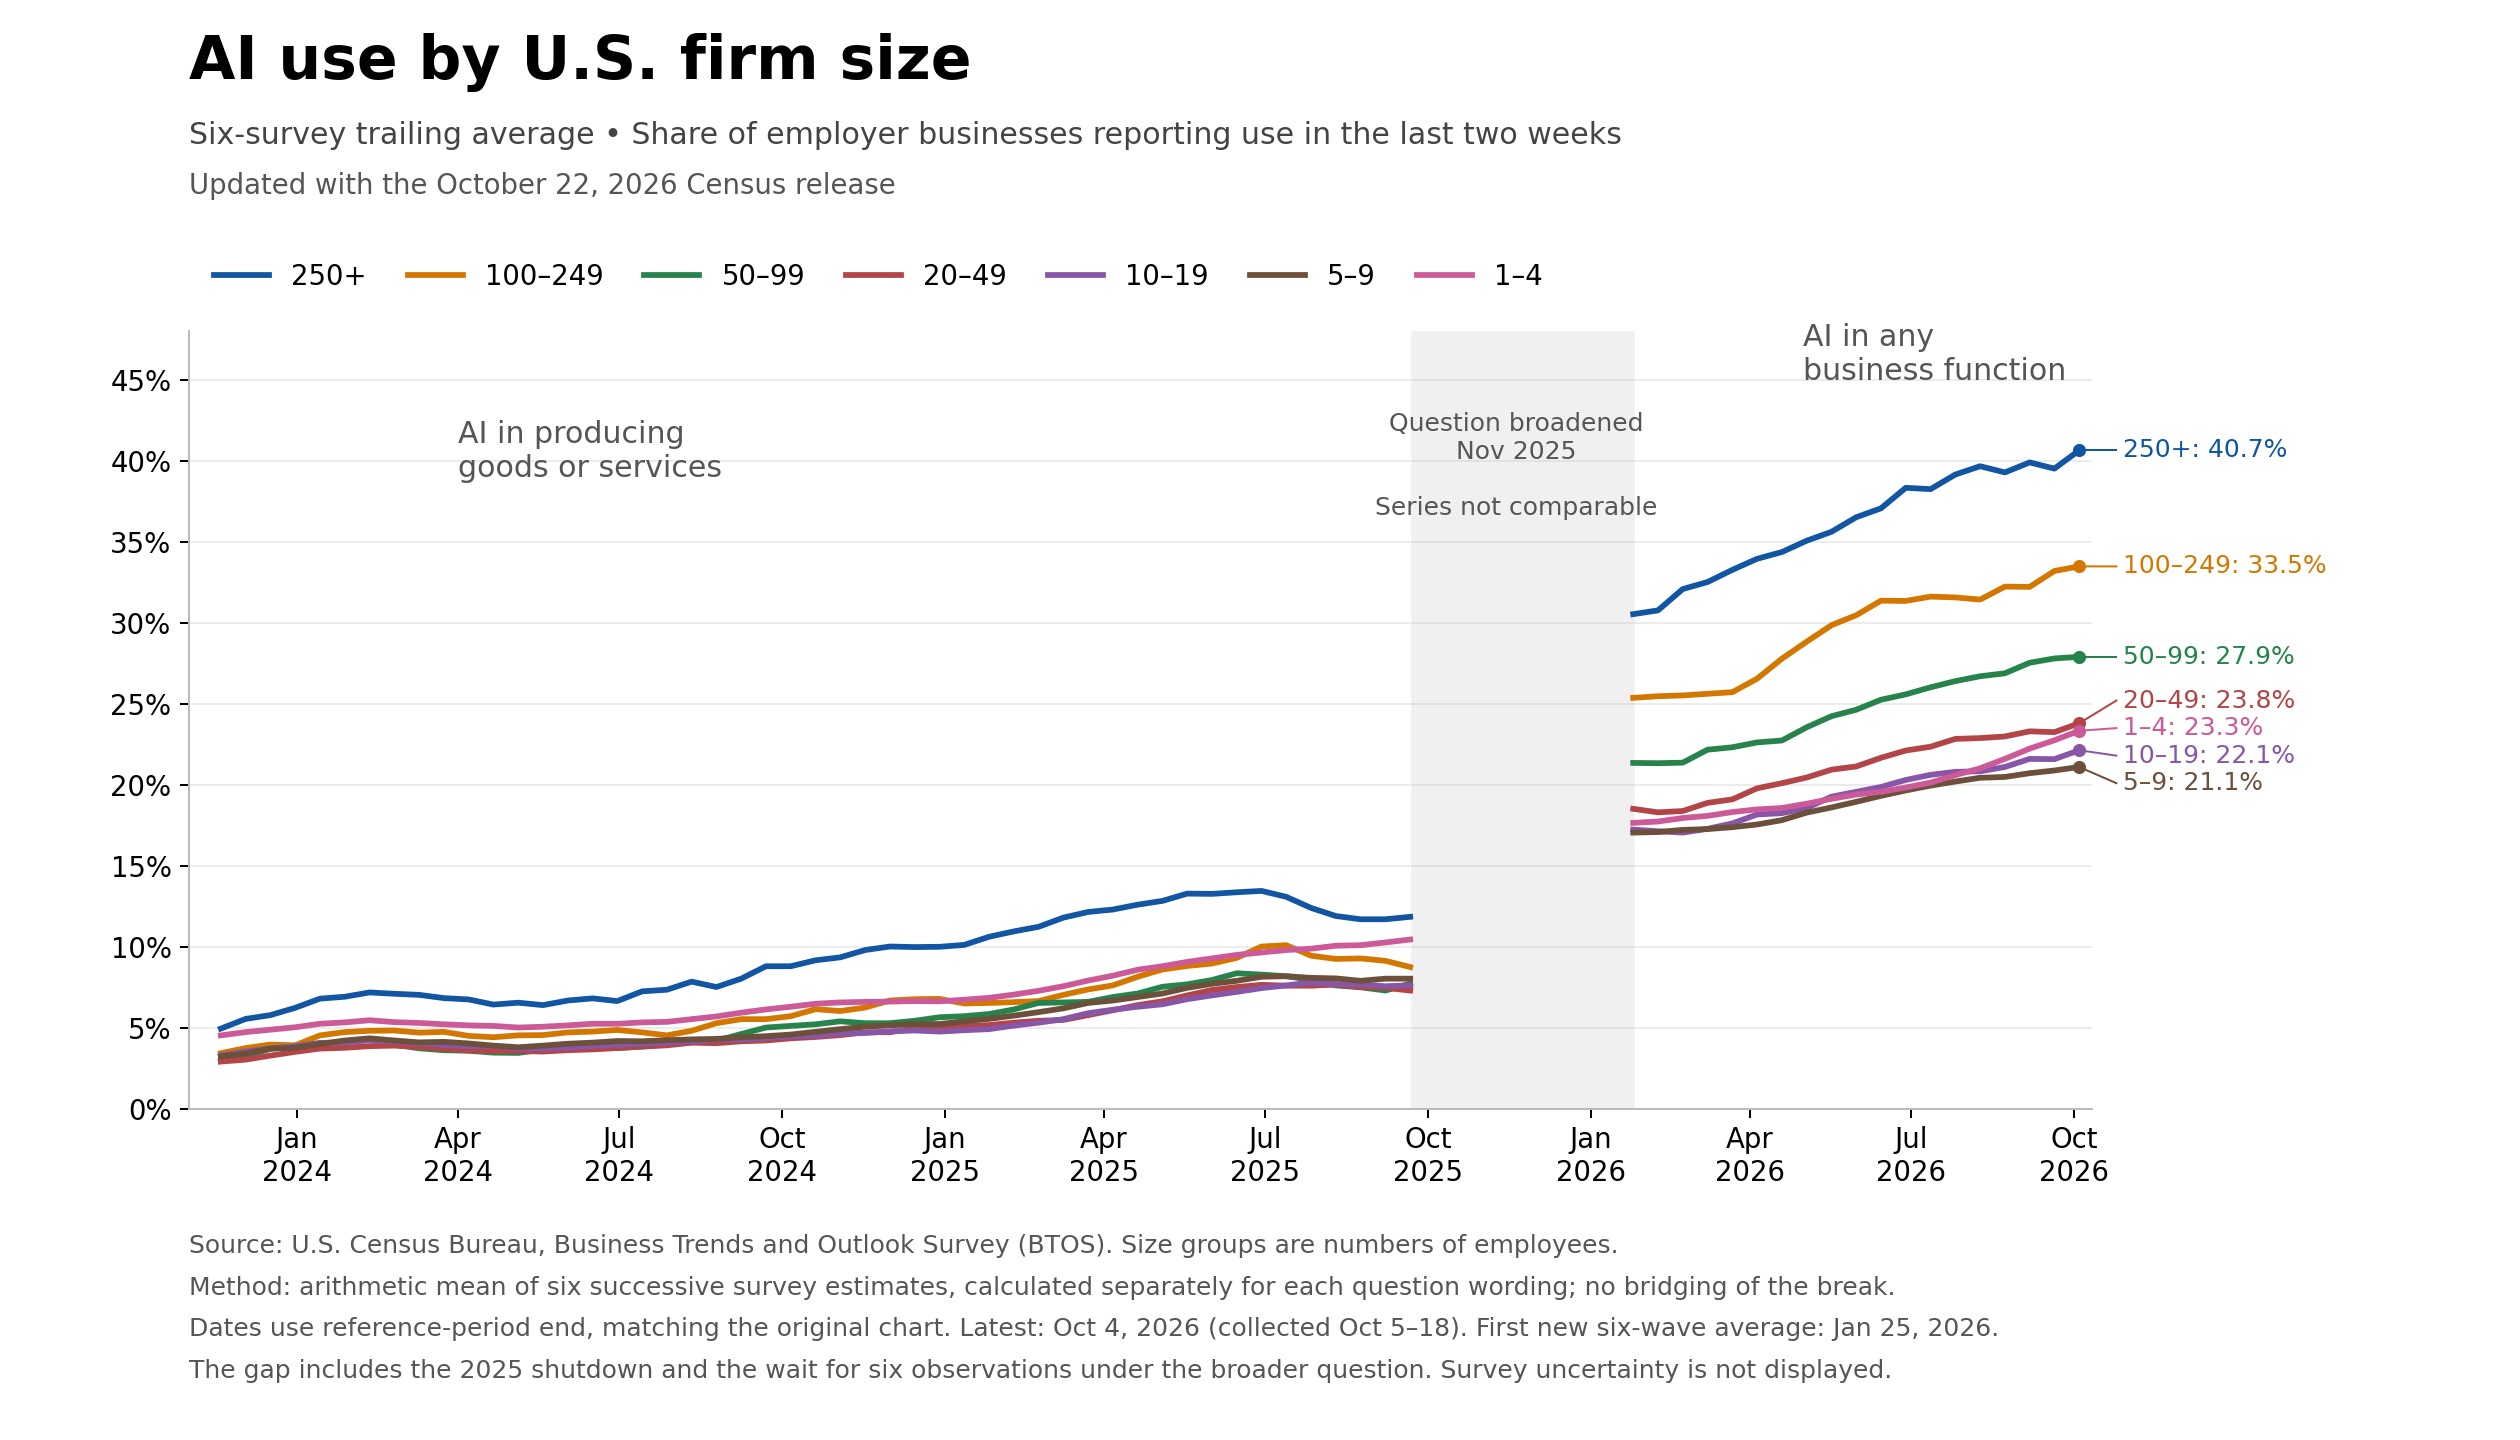
I'm implying they may be biased in what they chose to report on and how they frame it, yes. Deciding which figures to turn into a chart is an editorial decision. I'm writing up a new version of the chart at the moment, but here's a preview: https://static.simonwillison.net/static/2026-11-01/5821A414-... Notes on where to find the data here: https://simonwillison.net/2025/Sep/9/apollo-ai-adoption/ | ||
| ▲ | timr an hour ago | parent [-] | |
> I'm implying they may be biased in what they chose to report on and how they frame it, yes. Deciding which figures to turn into a chart is an editorial decision. I think the Apollo thing is a fairly dumb hot take based on a near-term wiggle in a graph, but it's hilarious that you are calling them biased. Pot, kettle, black, etc. Substantively, I don't think it's surprising at all to see those lines go up -- it would be shocking if they didn't go up, given the intensity of the hype. The slope is what matters. In particular, I wouldn't argue that your graph shows any kind of acceleration in adoption over time. | ||