| ▲ | maccard 3 hours ago |
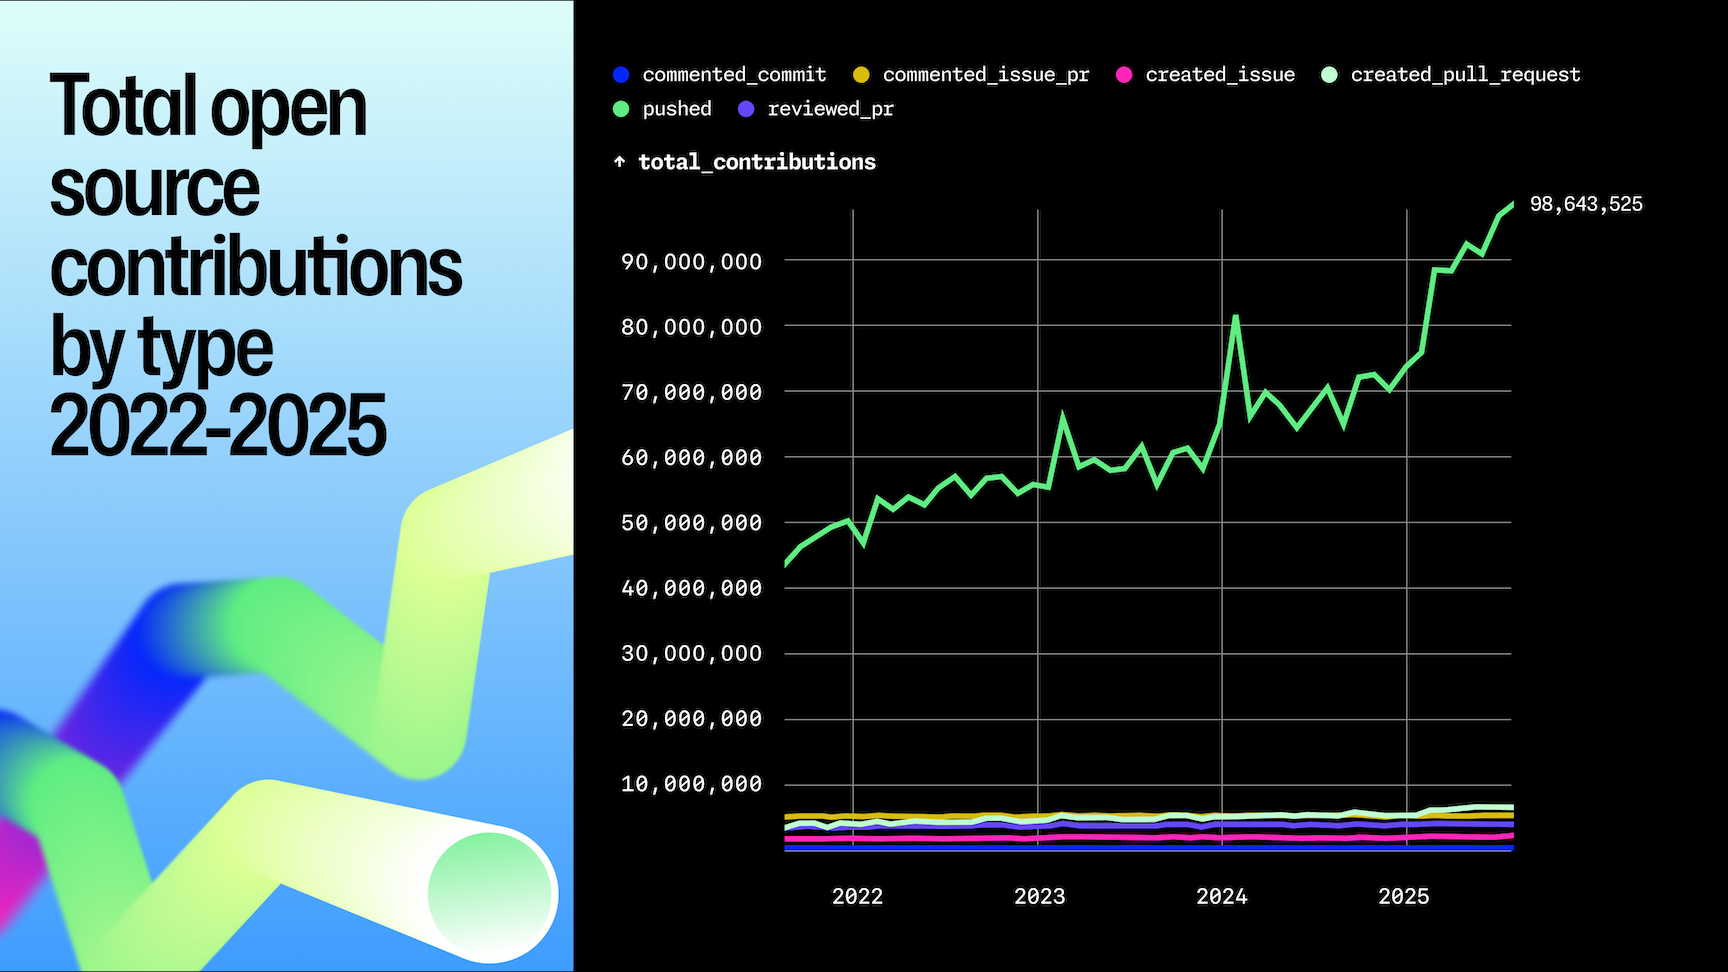
| It's kind of hard to read this with a straight face. The unlabelled graph with big numbers on top, the priorities that don't match with what we're experiencing, and a list of things that they're doing without a real acknowledgement of the _dire_ uptime over the last 12 months.... |
|
| ▲ | georgyo 3 hours ago | parent | next [-] |
| These are not the worst graphs in the world... Sure the bottom left axis is not labeled, but it still conveys the point correctly. The growth between 2023->2024->2025->2026 is growing quickly. And that in the end/beginning of 2026 they say more growth than the three years before, combined! You don't need to know the bottom left axis number. We do have to assume the graph is linear, and not some kind of negative exponent log graph. But given the rest of the content, I think that is safe to assume. Any company that experiences significantly more growth than they were planning for will have capacity issues. The priorities are most inline with that. The are way beyond the point that they can just add more hardware. They need to make the backend more efficient, and all the stated goals are about helping there. |
| |
| ▲ | johndough 2 hours ago | parent | next [-] | | > You don't need to know the bottom left axis number. We very much do. The graph suggests an insane growth in PRs from almost zero to 90M. Now compare this misleading graph with this much clearer one, which shows that the growth over the last three years has been less than 80%: https://github.blog/wp-content/uploads/2025/10/octoverse-202... | | | |
| ▲ | maccard 2 hours ago | parent | prev [-] | | > These are not the worst graphs in the world... Sure the bottom left axis is not labeled, but it still conveys the point correctly. No, they're completely useless. Using the "New repos per month" as an example, if the bottom left is 1m, then that's a 20x increase in 2 years which is a lot. If the bottom left is 19m, it's a 5% increase in 2 years which is nothing. The massive surge on their labelled X axis starts in 2026, and these issues have been going on for a lot longer than that. GHA has been borderline unusable for a year at this point, if not longer. > But given the rest of the content, I think that is safe to assume. The rest of the content is "we're working on it", and "here's two outages in the last 14 days, one of which caused actual data loss" | | |
|
|
| ▲ | ncruces 3 hours ago | parent | prev | next [-] |
| More numbers: https://x.com/kdaigle/status/2040164759836778878 What's the question here, you don't believe growth is currently exponential, or do you think it shouldn't be hard to scale, when 10x YoY is not enough? |
| |
| ▲ | OtherShrezzing 2 hours ago | parent | next [-] | | As a business user, our costs have gone up while service has gone down dramatically. Meanwhile our marginal cost to GitHub has hardly changed. Where our costs to them have increased, they mostly charge us per cpu minute, so obviously aren’t making any kind of loss on our account. I’m sure they’re experiencing scaling issues across the platform, but it’s unacceptable for that to have a negative impact on us when we're sending them $250/dev/yr for (what is in all honesty) hosting a bunch of static text files. | | |
| ▲ | ncruces 2 hours ago | parent | next [-] | | I understand that, and maybe GitHub became a bad deal because of that. But if anything, their post and your reply are precisely an endorsement of usage based billing. The bit that's growing 13x YoY (and which they expect will easily blow past that) is unmetered - commits. The bit that is metered (for some, not all folks) - action minutes, grew only 2x YoY. GitHub was not built to limit the number of commits, checkouts, forks, issues, PRs, etc - nor do we want them to - but that's what's growing ridiculously as people unleash hordes of busy beaver agents on GitHub, because their either free or unlimited. Where there are limits - or usage based billing - people add guardrails and find optimizations. Because for all the talk, agents don't bring a 10x value increase; otherwise, they'd justify a 10x cost increase. Besides, other forges are having issues too. Even running your own. We have Anubis everywhere protecting them for a reason. | |
| ▲ | graemep 13 minutes ago | parent | prev | next [-] | | In that case, why are you using them at all? | |
| ▲ | rdevilla 2 hours ago | parent | prev | next [-] | | > we're sending them $250/dev/yr for (what is in all honesty) hosting a bunch of static text files. You know, you can just host your own code forge. Or you can just drop gitolite on a server. Or pull directly from each others' dev machines on a LAN. GitHub is not git. | |
| ▲ | dist-epoch 2 hours ago | parent | prev [-] | | > we're sending them $250/dev/yr for (what is in all honesty) hosting a bunch of static text files. so start a GitHub competitor which bills $50/dev/yr for solving this easy problem and make a lot of money? |
| |
| ▲ | maccard 2 hours ago | parent | prev [-] | | These numbers should have been in the blog post, not the graphs that are present. > What's the question here, you don't believe growth is currently exponential, or do you think it shouldn't be hard to scale I think you're putting words in my mouth here; I didn't say either of those things. I'm saying that this blog post is a meaningless platitude when the github stability issues predate this, and that all this post says is "we hear you're having issues". | | |
| ▲ | ncruces 2 hours ago | parent [-] | | Sorry if I misread your intent. I just think their charts, taken at face value, show substantially the same thing (for PRs, commits, new repos). Either those charts are a bald-faced lie (the tweet could be as well) or there is no way for that chart to be something else. The only way to fake exponential growth like that would be to use an inverse log scale (which would be a bald-faced lie). It doesn't even really matter what's the y-axis baseline, unless we really think growth was huge in 2020, then cratered to zero by 2023, now back to the previous normal. As for the rest of the post, I do think it's panic mode platitudes. But I honestly don't know what I'd write instead that's better. You can already see people complaining loudly where they instead of "we'll do better" decided to limit usage. | | |
| ▲ | maccard an hour ago | parent [-] | | No problem - it's tough online sometimes. > I just think their charts, taken at face value, show substantially the same thing (for PRs, commits, new repos). The problem is that these charts show the massive exponential growth in 2026. But this didn't start in 2026, this has been going on since early last year. My team had more build failures in 2025 due to actions outages or "degraded performance" than _any other reason_ and that includes PR's that failed linting or tests that developer were working on. > As for the rest of the post, I do think it's panic mode platitudes. But I honestly don't know what I'd write instead that's better. IMO, this needed to be written a 6 months ago (around the time that the memo of them prioritising the migration to Azure was released), and then this post should have been "We're still struggling, this isn't good enough. Here's the amount of growth, here's what we've done to try and fix it, and here's what we're planning over the next 3-6 months", instead of "Our priorities are clear: availability first, then capacity, then new features" and "We are committed to improving availability, increasing resilience, scaling for the future of software development, and communicating more transparently along the way." This isn't transparency (yet). |
|
|
|
|
| ▲ | ramon156 3 hours ago | parent | prev | next [-] |
| "We hear you" in ~300 words, basically. |
|
| ▲ | ferguess_k 3 hours ago | parent | prev [-] |
| You can do the same with so many clients. |