| ▲ | kbrkbr 6 days ago | |
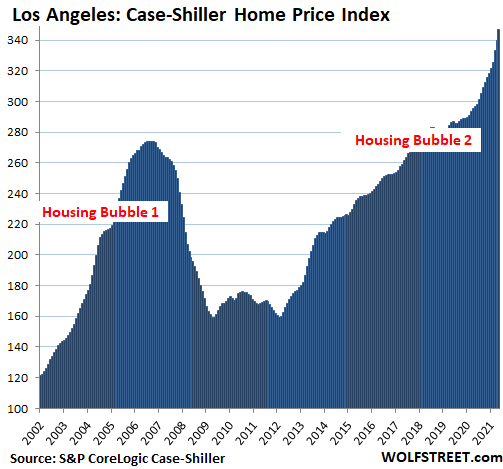
Here is an example of the mix-up (from a bit above): > The greatest values, and change in values comes just before the bubble bursts. This seems to be talking about the mathematical model. Then you go on: > In fact, tulips were most valuable, and those values were climbing at the highest rate before the tulip bubble burst. That seems a jump to the modeled. And you speak of the modeled as if it was the model. And by the way, if this graph [1] is correct, then what you say is also false. The valuations do not rise exponentially, but slow before the bubble bursts, very visibly. This is also true for the 2008 housing bubble in the local index [2]. I think that shows quite well that there are two layers. And there is the question of the fit between them. Having seen those two graphs I think I'd rather expect reduction in the rate of change of valuation shortly before the bubble bursts. That model appears to fit better what I'd expect in economical bubbles (but not in soap bubbles), namely a growing sense of risk that counteracts the fomo. [1] image Tulip Price Index 1636-37 here https://www.historydefined.net/how-did-tulips-create-the-wor... [2] https://wolfstreet.com/wp-content/uploads/2021/07/US-Housing... | ||
| ▲ | d4rkn0d3z 6 days ago | parent [-] | |
There is no issue with stating the model and an example of the modeled in the real world such as tulips. You are simply taking a favourable view on when the bubble "burst" occurs in order to see what you want. My point stands that valuations and there growth are not really distinguishing bubble/non-bubble. Thanks for proving me correct in that. | ||